

Interactive Dashboard
Streamlining the interactivity and feedback between instructors and students!


Overview
Role & Team
I worked with Jiayu Xu, Nihad Abu Aker, Andres del Cid for a 4 week project.
Goal
Design a dashboard that fulfills the needs of all key stakeholders: instructor & students.
What I did
User research & testing, persona/storyboard generation, UX/UI design, team resolution.
What I delivered
User personas, customer journey maps, market research, sketches, wireframes, lo/mid/hi screens.

Have up-to-date intuitive feedback while maintaining easy facilitation! 📚
Create a student & teacher dashboard that prioritizes visual feed back, build circulative discussions for students and allows easy facilitation for the instructor.
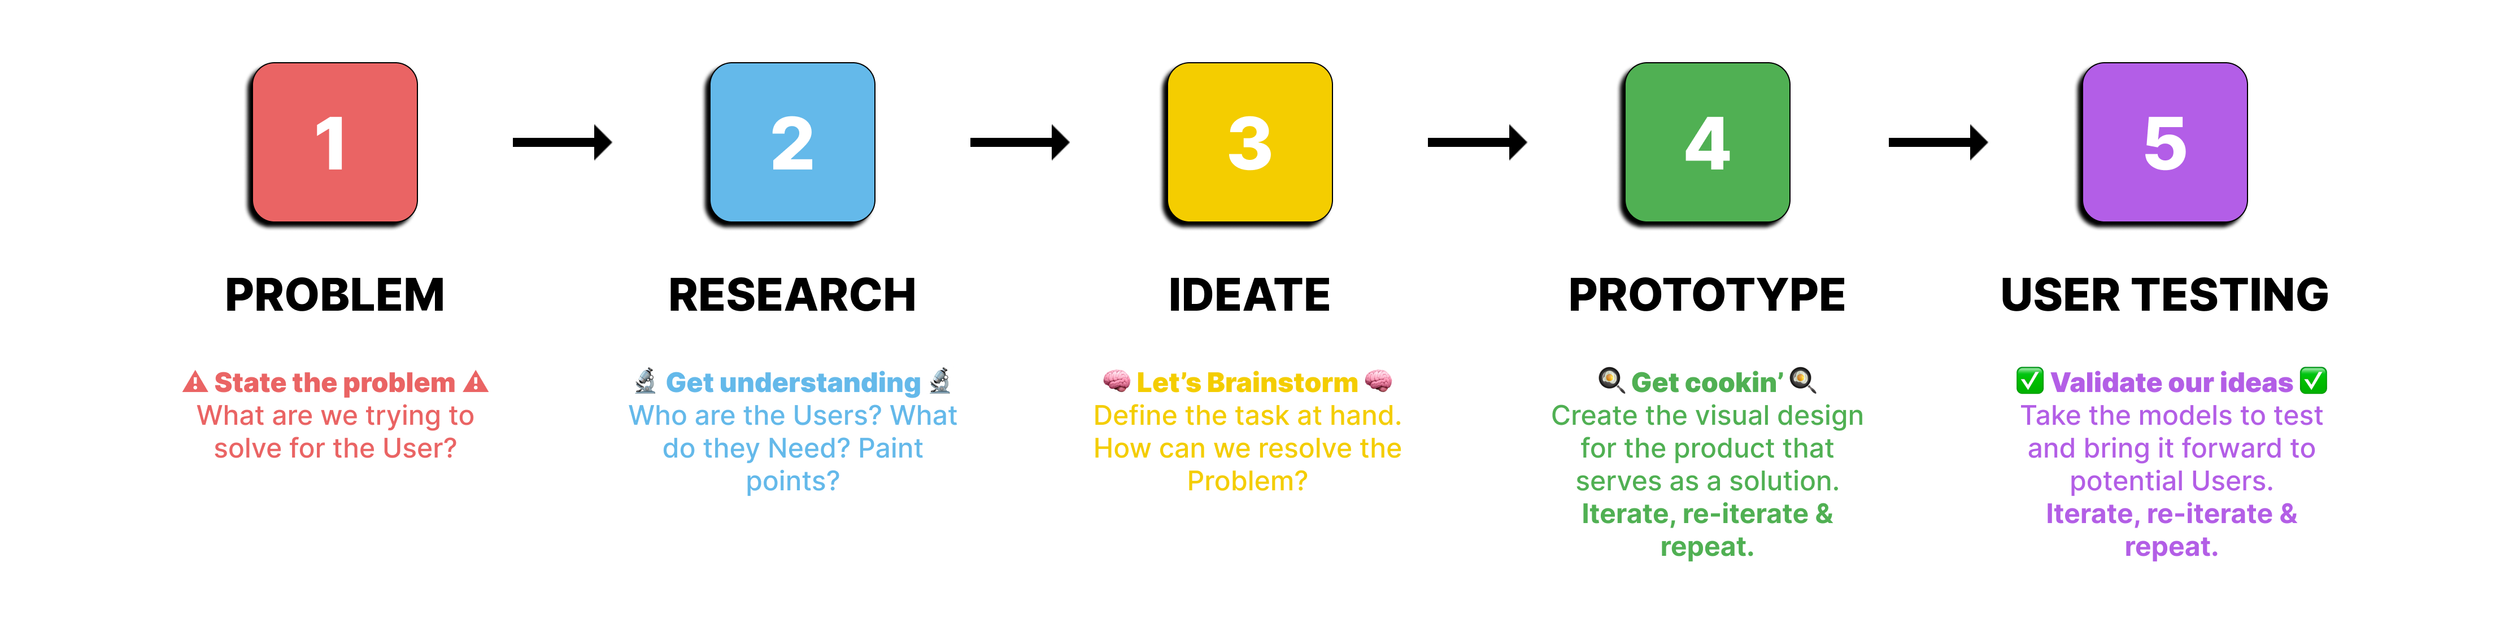
Process

Problem
Students are often left confused by directionless feedback. Instructors are struggling to organize facilitation.
School nowadays are a busy, hectic and stressful environment especially with COVID 19— everything is now virtual, without that person to person interaction. Thoughts get misconstrued and facilitation becomes disorganized. The idea is to design an interactive dashboard with the needs of all stakeholders. Our task was to consider and sum the key information down to the most important goals, needs and noticing any overlaps and where they differ.
“As education becomes more prominent online — How can we make teacher student feedback more interactive and streamlined?”
Solution
💡Our project aim:
Create an interactive dashboard by balancing the pain points of all stakeholders and diluting all needs to create most the important features.
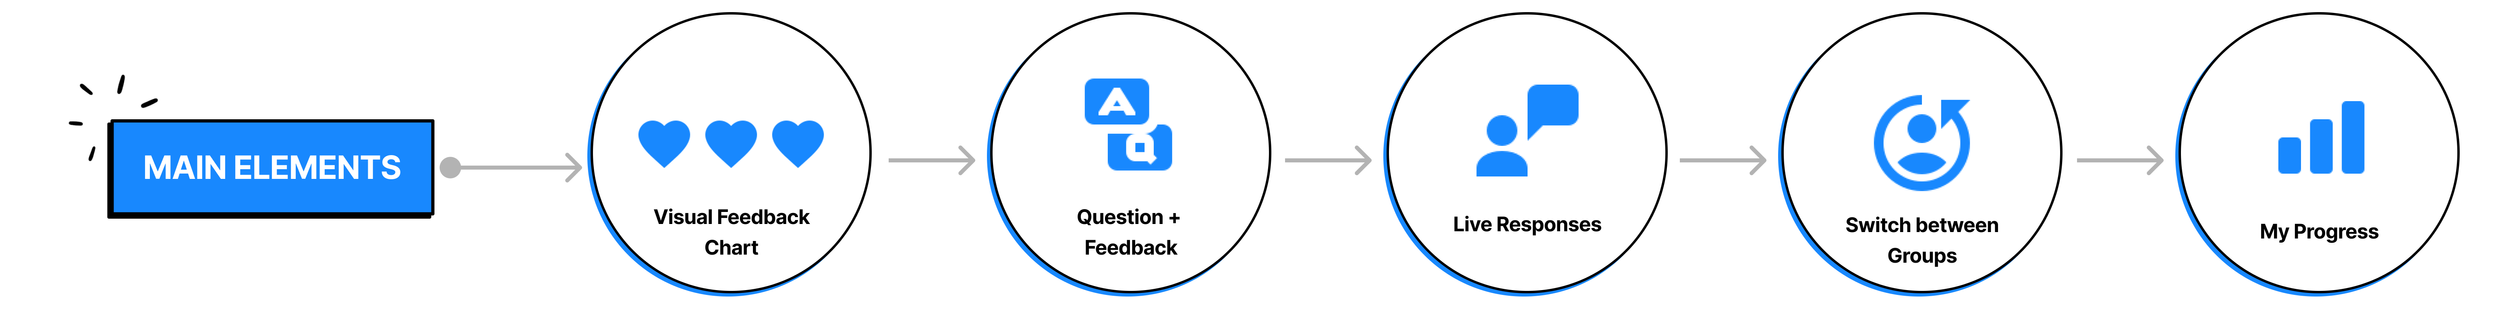
Student Profile
Student View

Feature
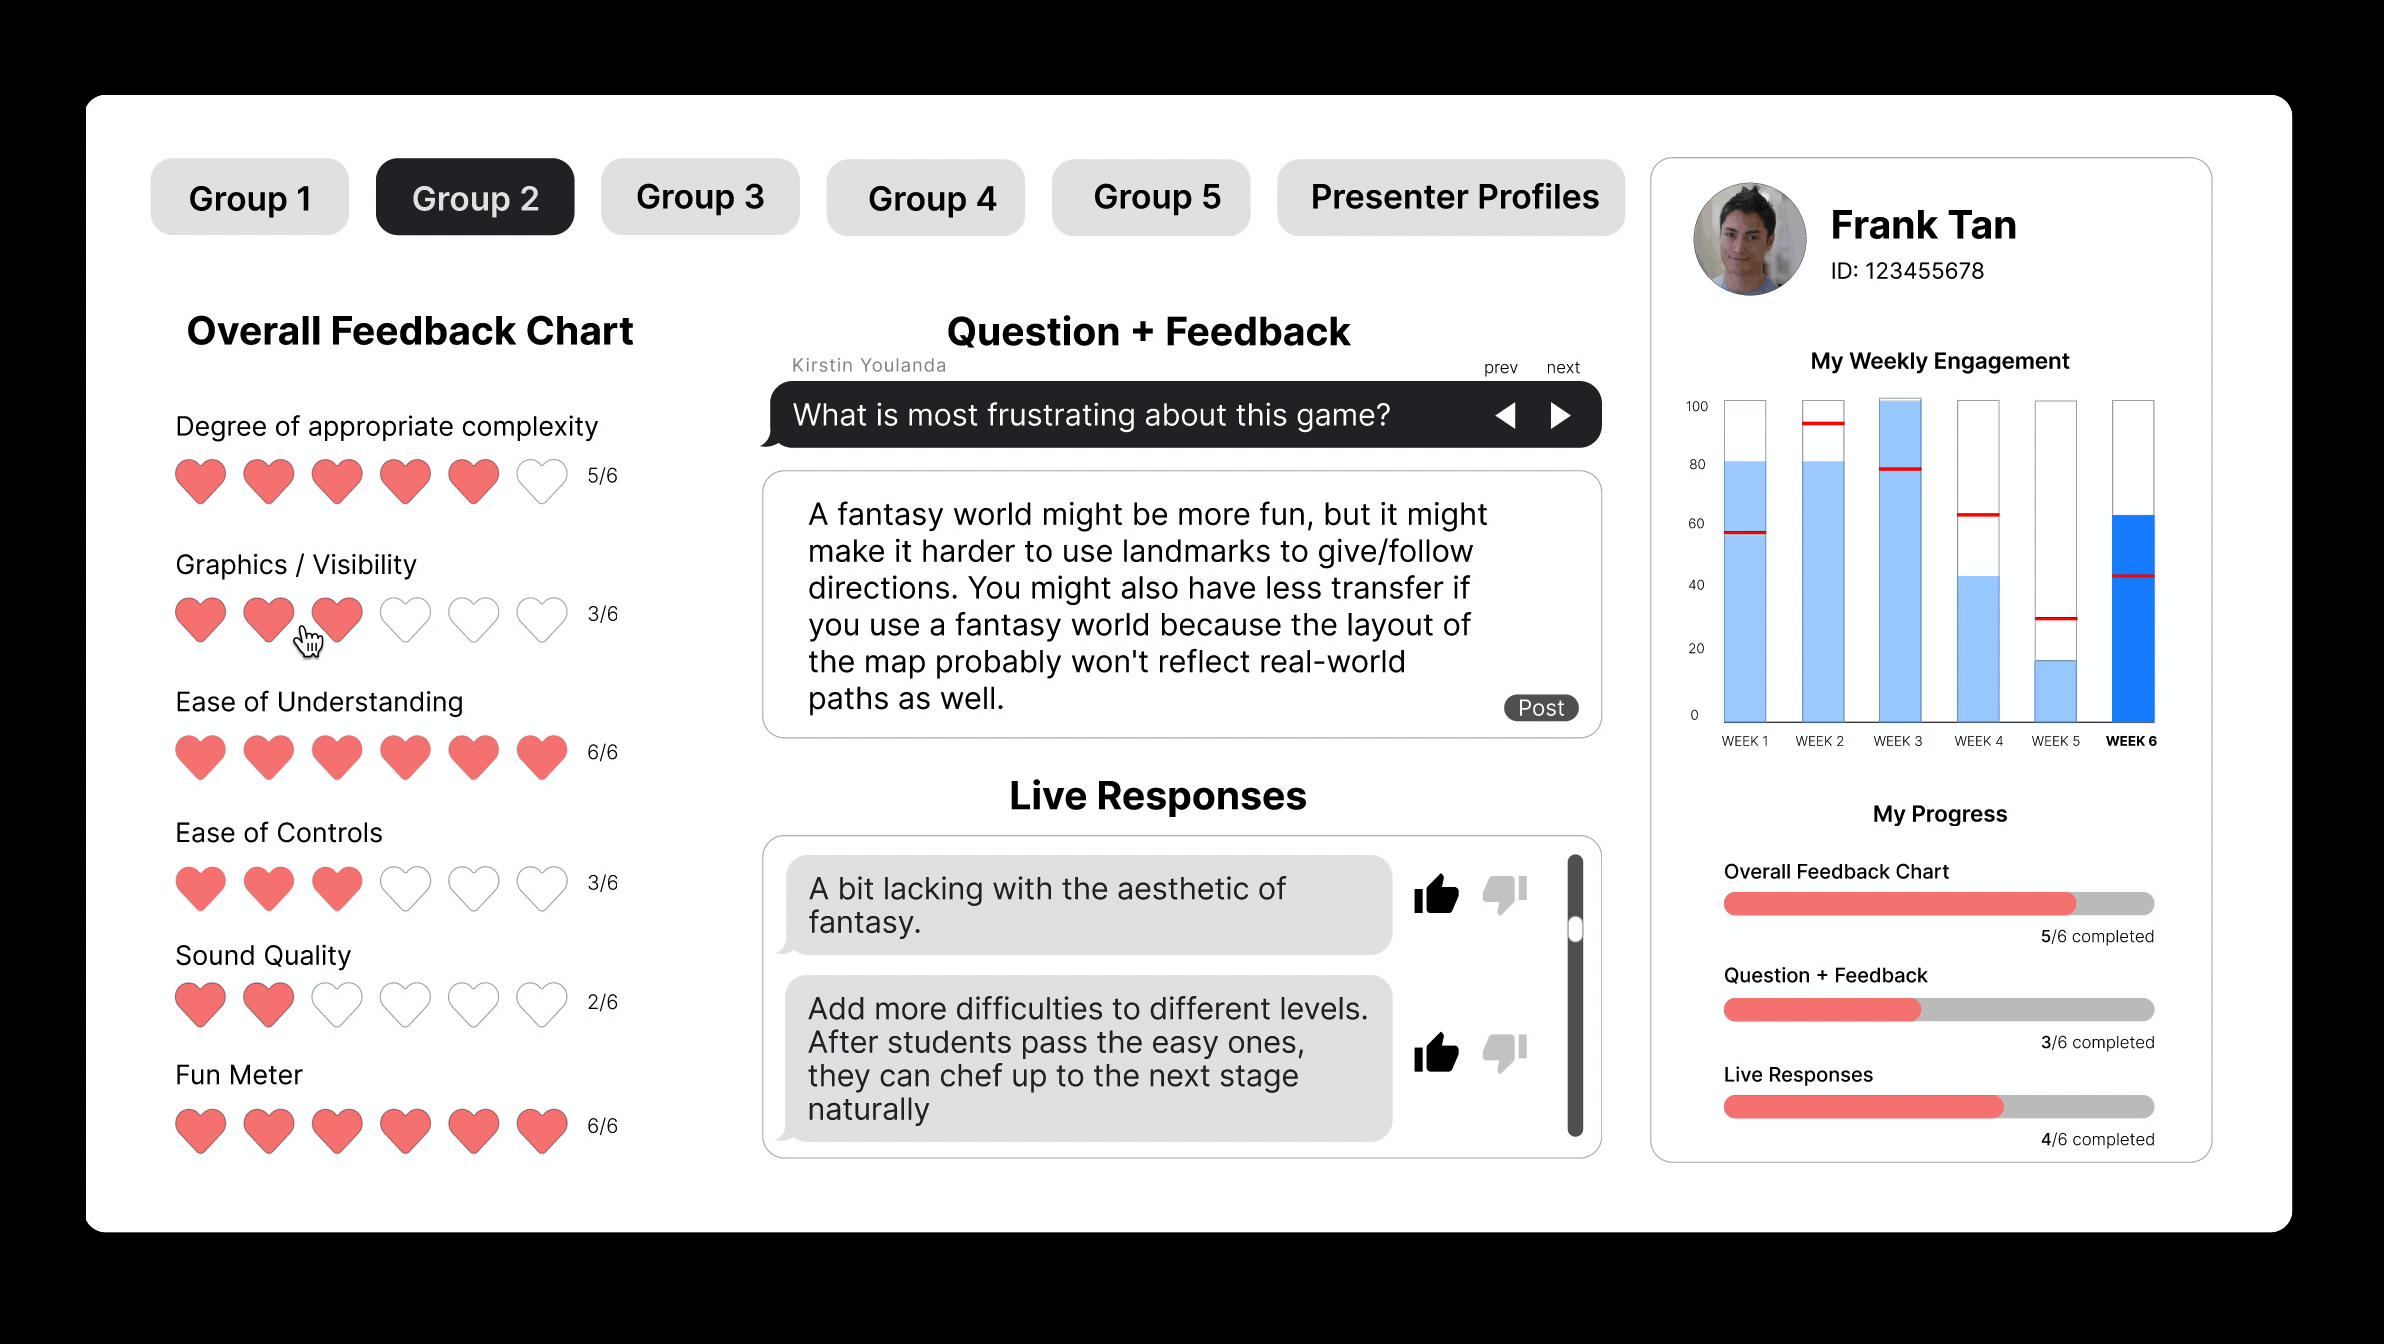
Visual Feedback Chart
Direct, Visual, Feedback

Feature
Quick Group Collaboration
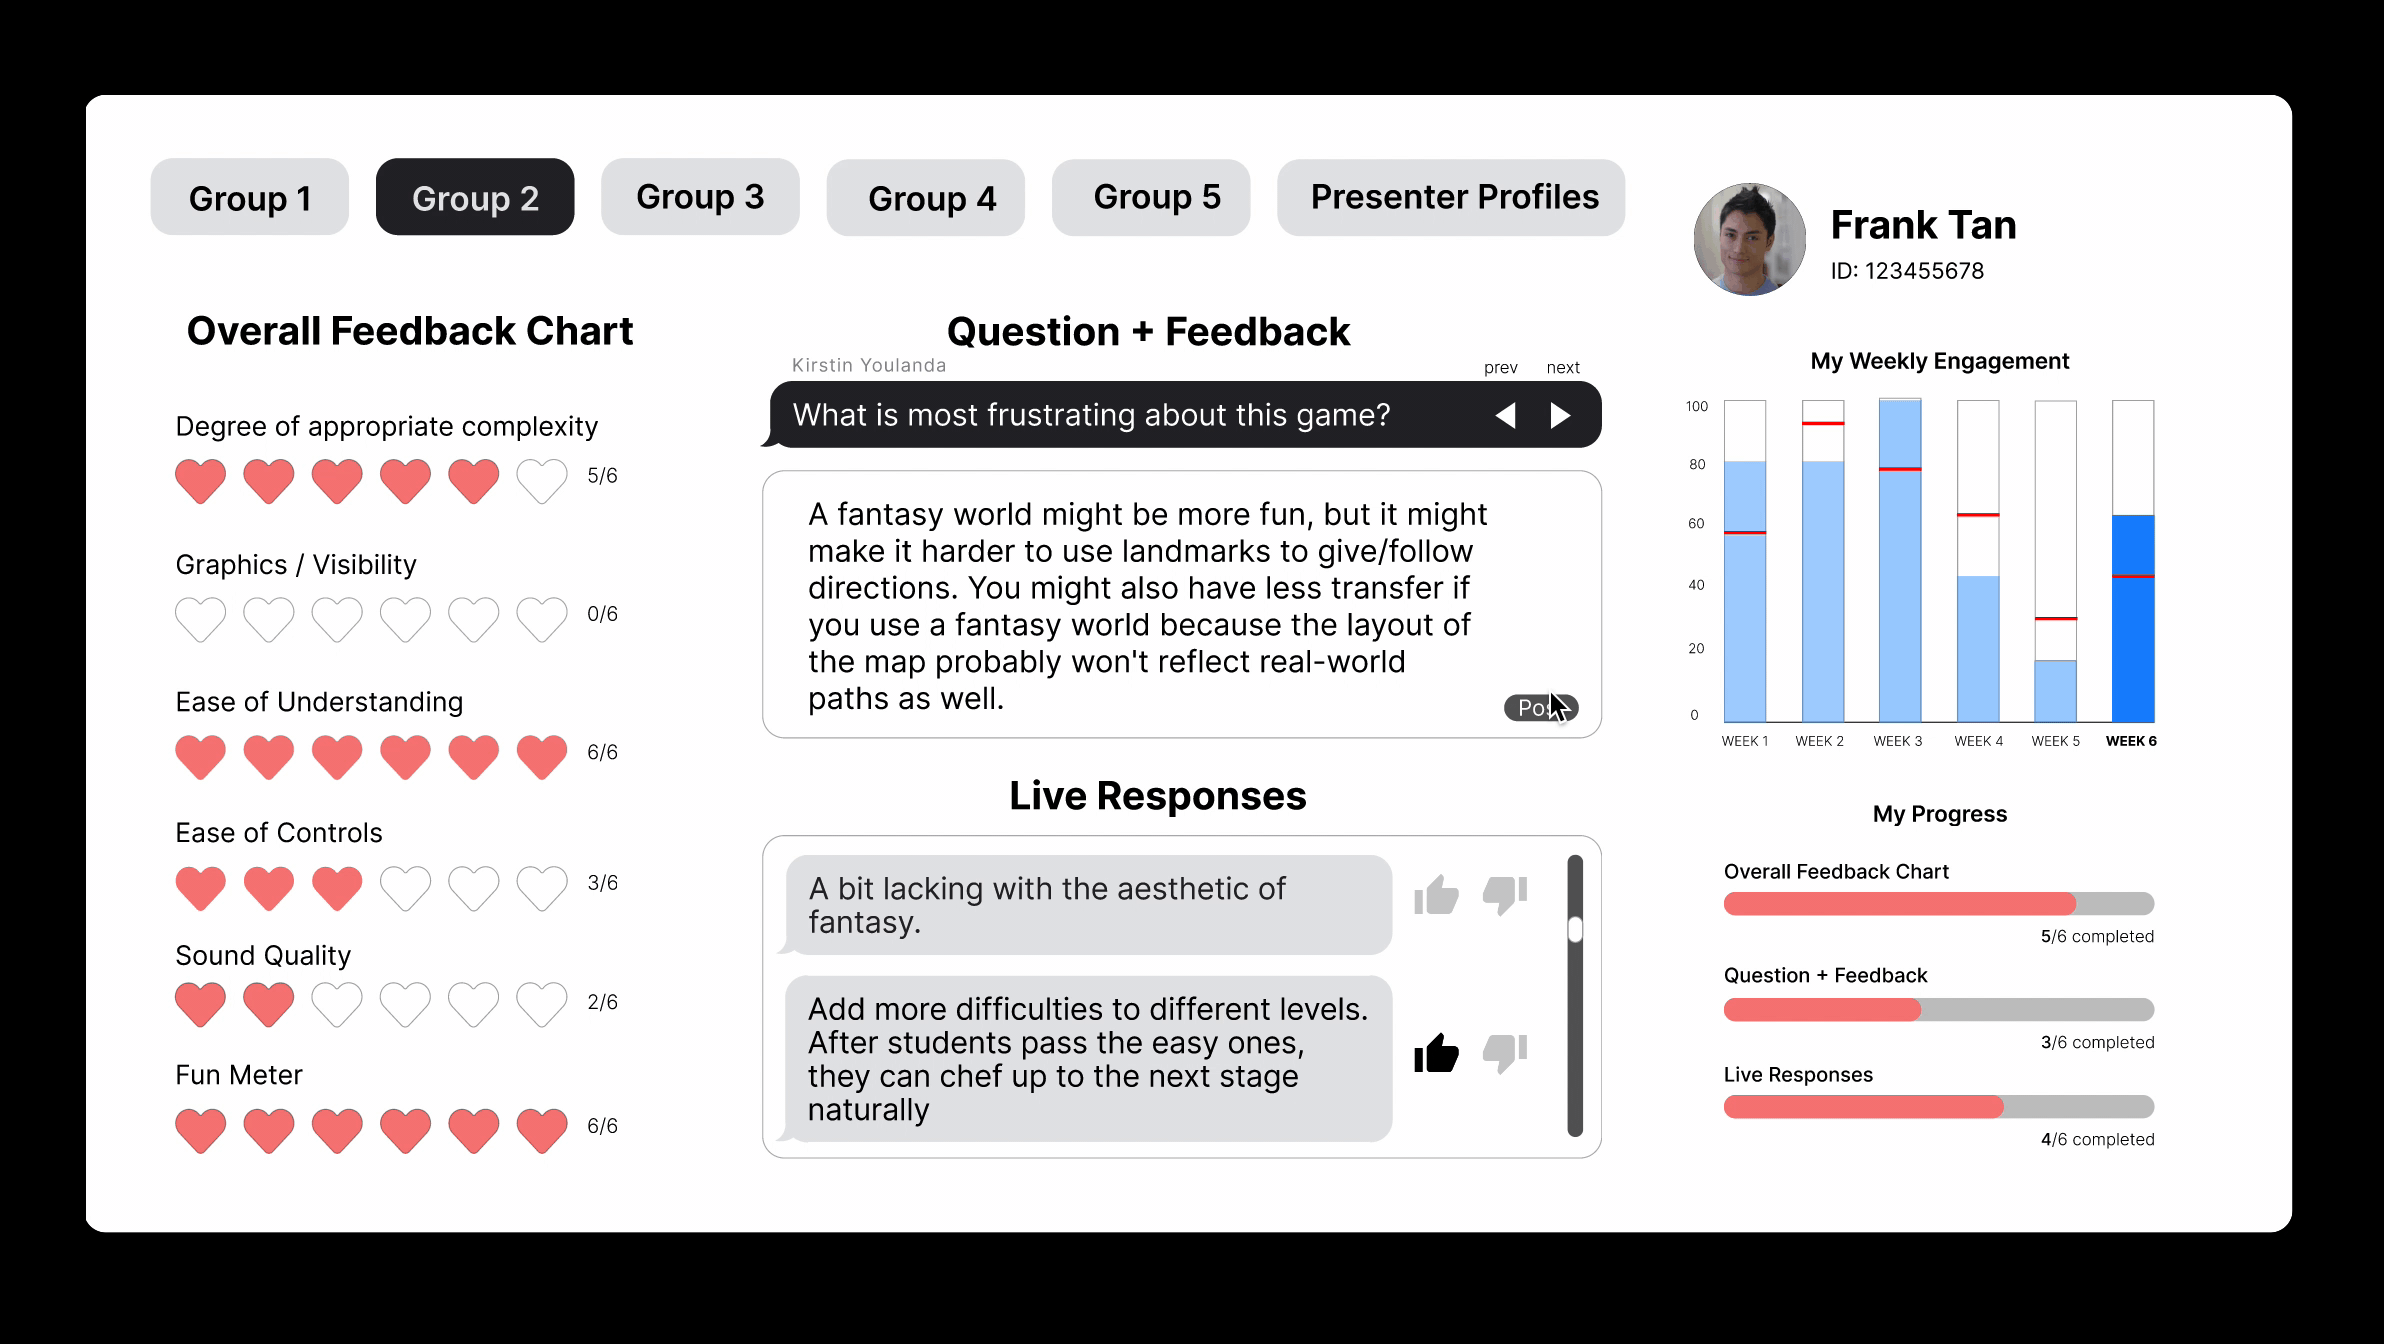
Real-Time, Visual, Intuitive

Feature
Question & Feedback + Live
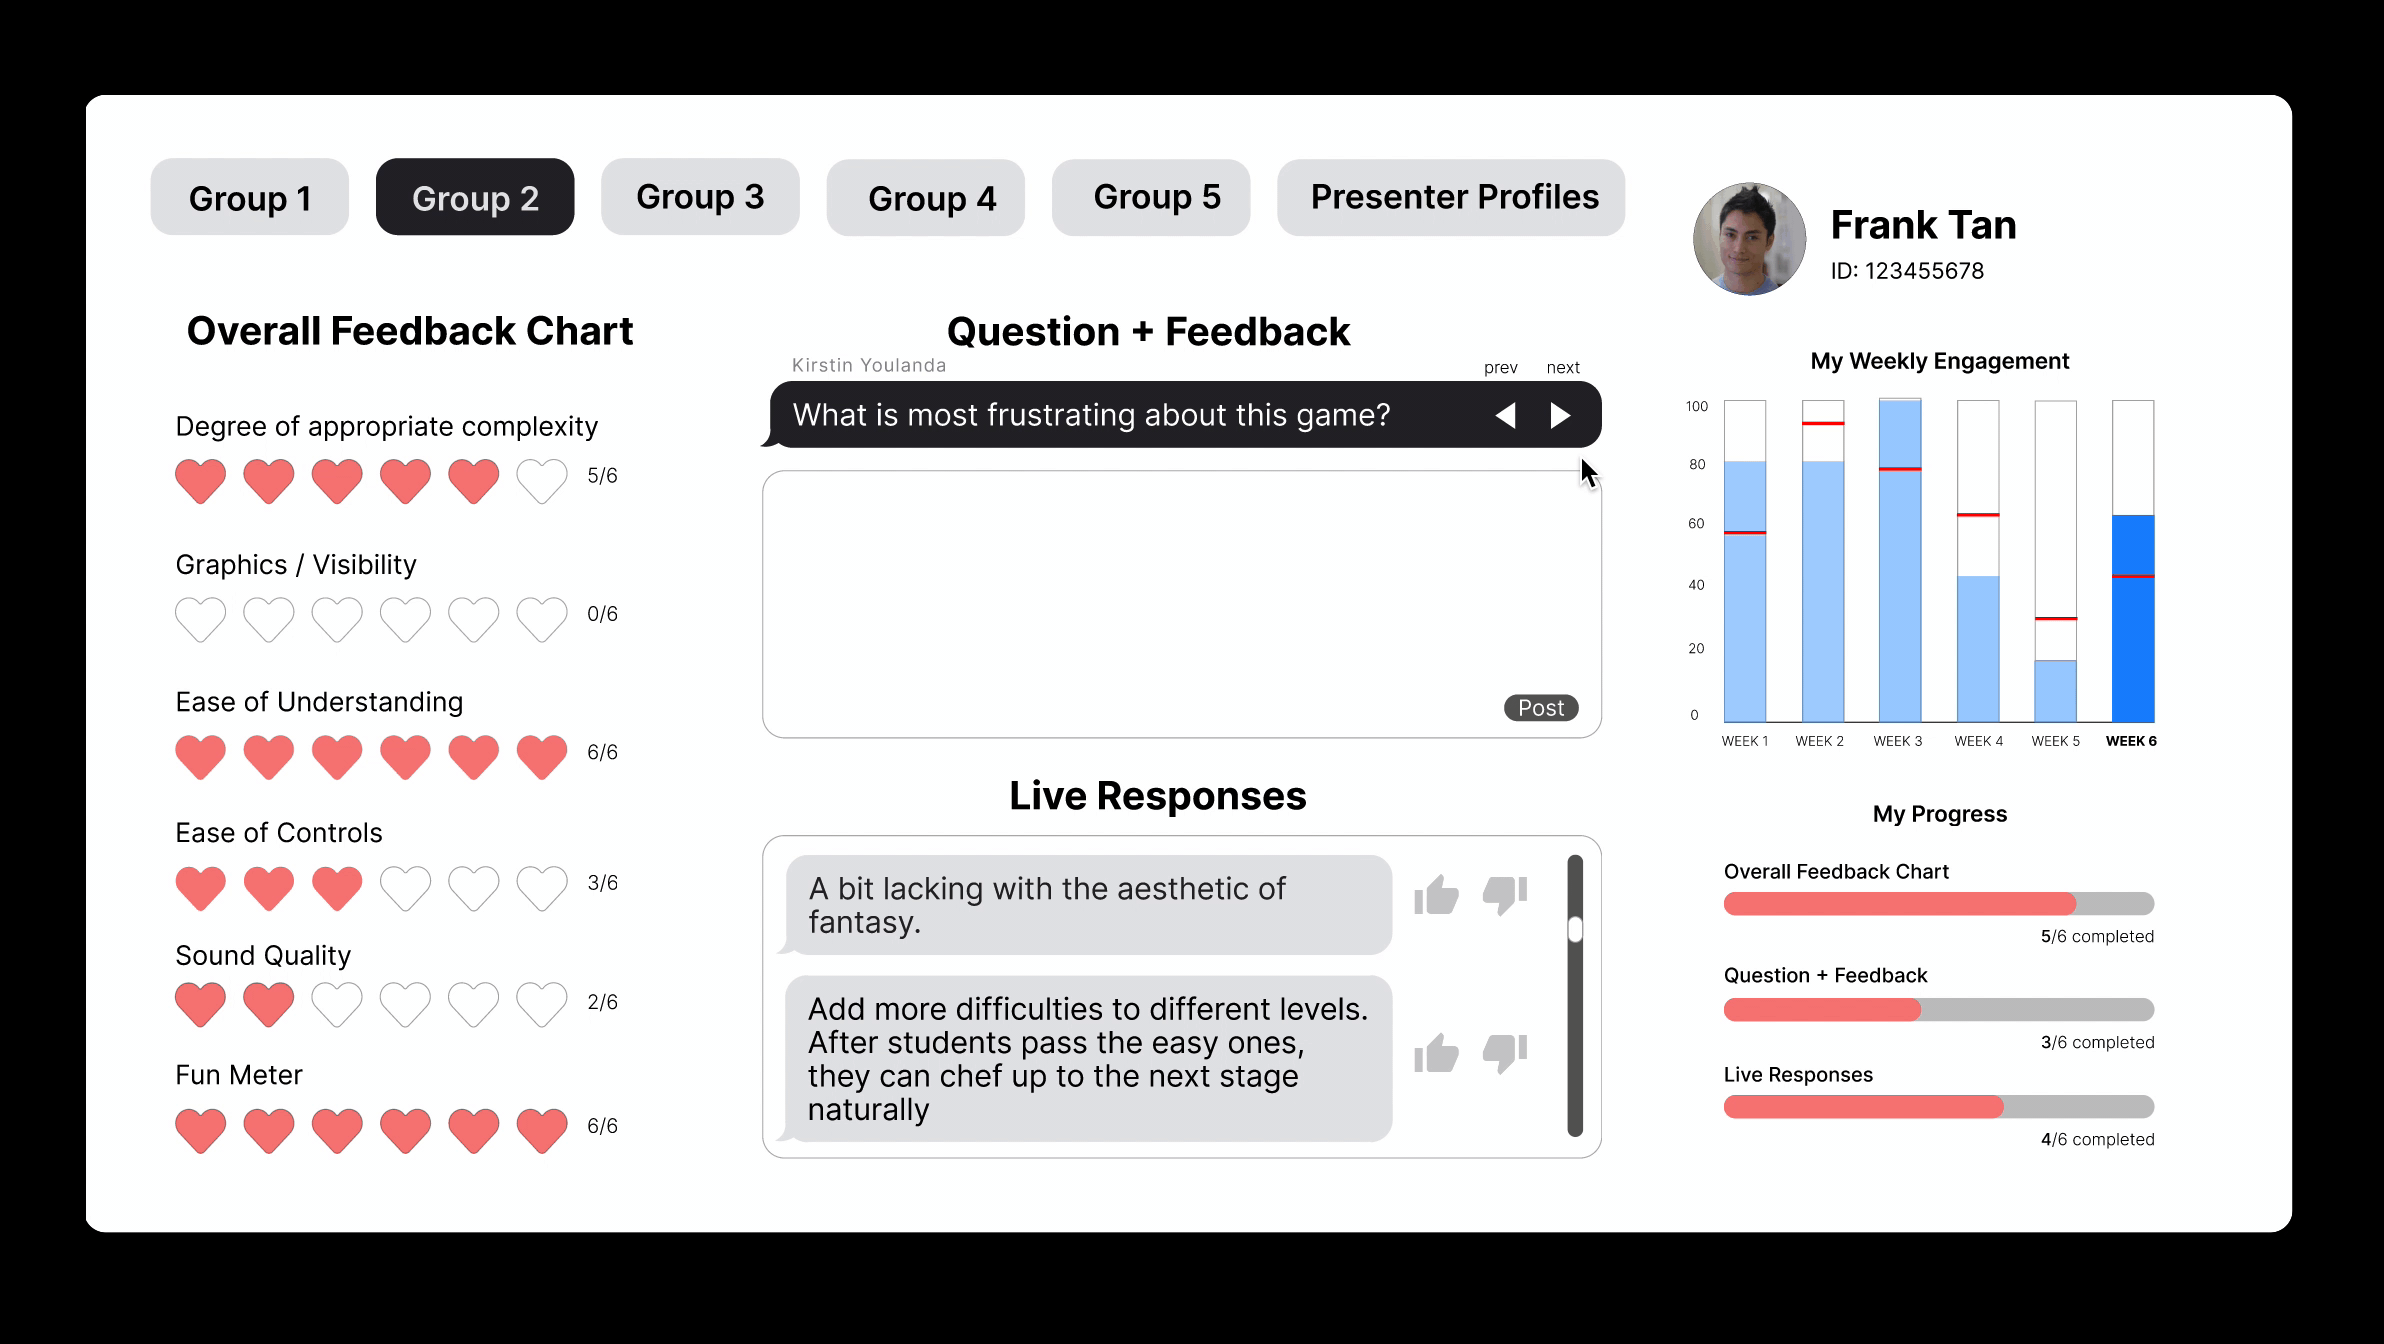
Keep up to date, participate

Feature
Presenter Profile & Group Switching
Organization, Participation, Keeping informed.
Overall Class
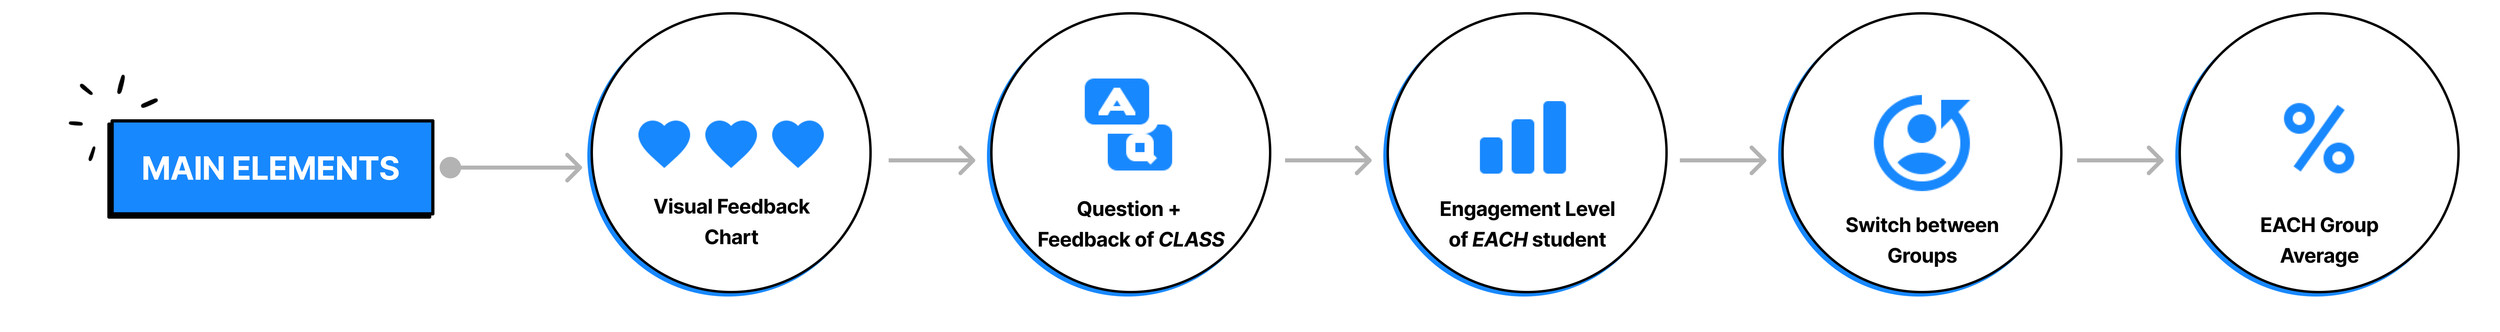
Instructor View

Feature
Visual Feedback Chart
Direct, Visual Feedback

Feature
High Engagement Level
Sorting, Easy to Identify

Feature
Overall Group Feedback
Clear, Average Feedback

Feature
Question + Feedback Live
Keep Up to Date
Individual Student
Instructor View

Feature
Visual Feedback Chart
Direct, Visual Feedback

Feature
Instructor Feedback Chart
Detailed Feedback

Feature
Weekly Engagement Level
Personalized Feedback

Feature
Question + Feedback Live
Keep Up to Date
Personas
There are 3 types of stakeholders: student (listener), student (presenter) & instructor.
Conducting preliminary research, interviewing participants, infinity diagramming, and creating hypotheticals through storyboarding; this helped us infer user behaviors and major pain points. Through many rounds of conducting interviews, Think-a-Louds, storyboarding and user testings, we got one step closer to determining what best features and types of feedback are needed for each type of stakeholder.

Student Presenter
Wants to grow and improve, unsure how to make his game prototype better.
Craves clear, concise and summarized information to support detailed discussions about those improvements.
Seeks feedback that is well thought out and understandable.
Wants to create something he is proud of.

Instructor
Seeks to ensure all student listeners are able to give high quality feedback. As well as different types of feedback.
Prevent distractions from students.
Collaboration within a safe environment is highly valued
Hard to remember all feedback after presentations.
Student Listener

Seeks to help his peers make improvements.
Tends to have difficulty organizing his ideas and thoughts to articulate feedback.
Feels limited, gets bored and distracted easily, needs constant engagement.
Overwhelmed with lots of ideas and lacks consistent stimulation and excitement.
Based on persona generation exercise, we needed to filter out and dilute to the most important needs. This allows us to determine highlighted features.

Key Features discovered through Infinity Diagramming & Wants / Needs analysis.

Ideation
Identifying the concept and some main features…
Based on the user studies of major goals, needs and pain points - rough preliminary sketches that showcases specific features are implemented for both the student listener & instructor view. Many features overlap in both views, however the way we approach visualizing these features will be tailored specifically to the user.
Instructor
View

Student Listener
View

We have some concepts and main features… now we need to understand the user flow.
Through a quick user flow exercise, we needed to determine which stakeholders contribute to what type of information and feedback. This allows us to determine the specific features that pertain to each type of screen.
Student View (personal profile + student feedback section)
Instructor View (individual student)
Instructor View (overall class)
There are 3 main screens here:
How do these views intersect and provide information for the main features?


Student View

Group Tab

Presenter / Listener Profiles

Overall Feedback Chart


Instructor Individual View
Drop Down Menu
Individual Engagement Level
Instructor’s Notes


Instructor Overall Class View
Drop Down Menu
Engagement Level
Average Feedback

Overall Class Feedback Chart
Design
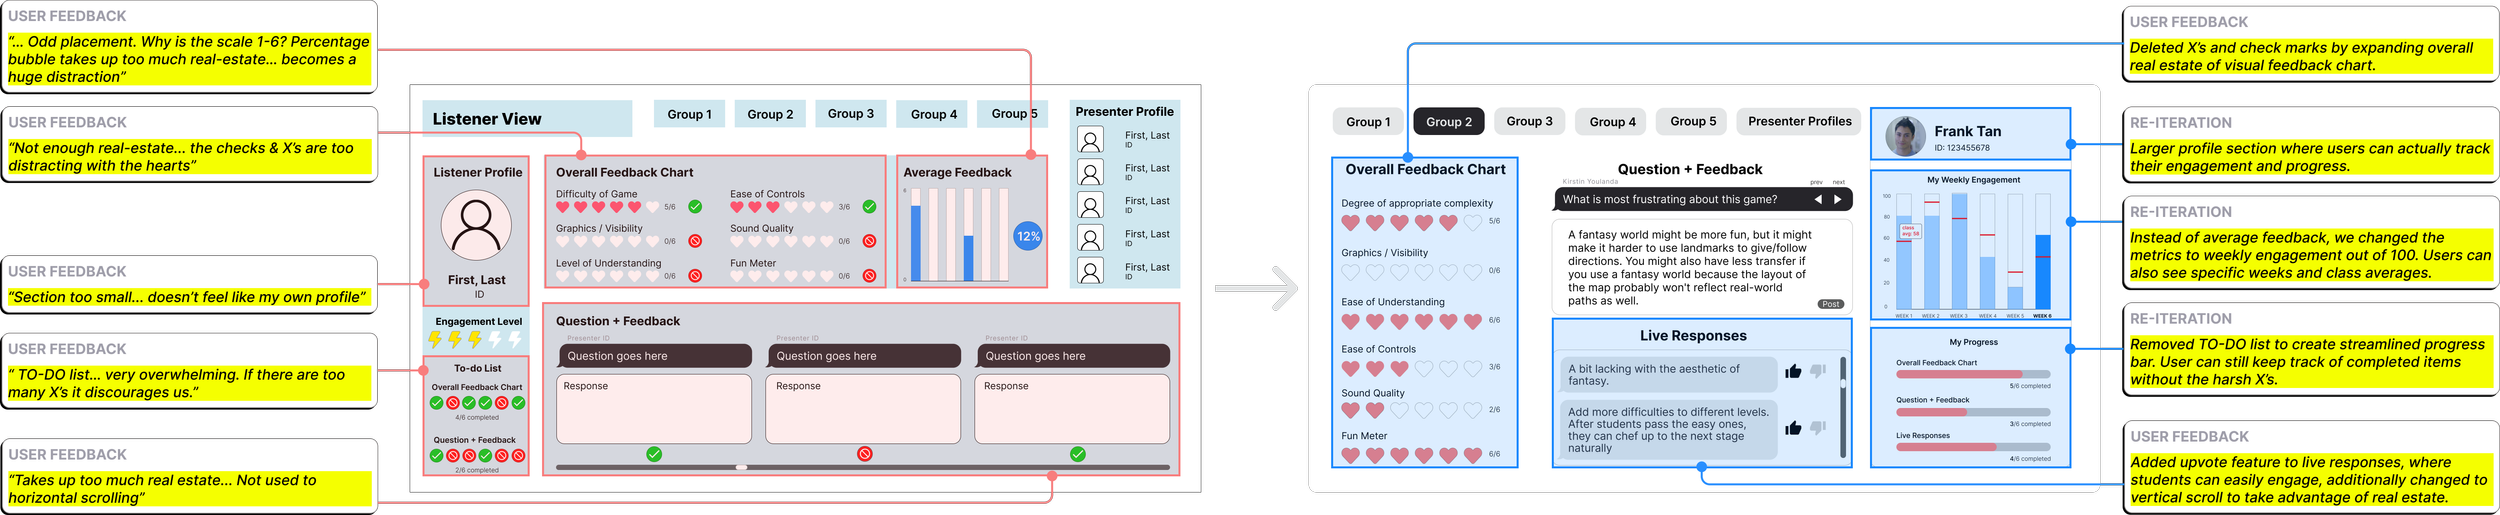
After multiple rounds of user feedback… we iterated then re-iterated each type of screen.
We interviewed and user tested multiple students and teachers through rounds of rapid prototyping. This helped us identify any areas of confusion and which sections should be most prioritized and if there are any instances of information overlap.
Student Profile
Re-iteration
Instructor View (Class Overview)
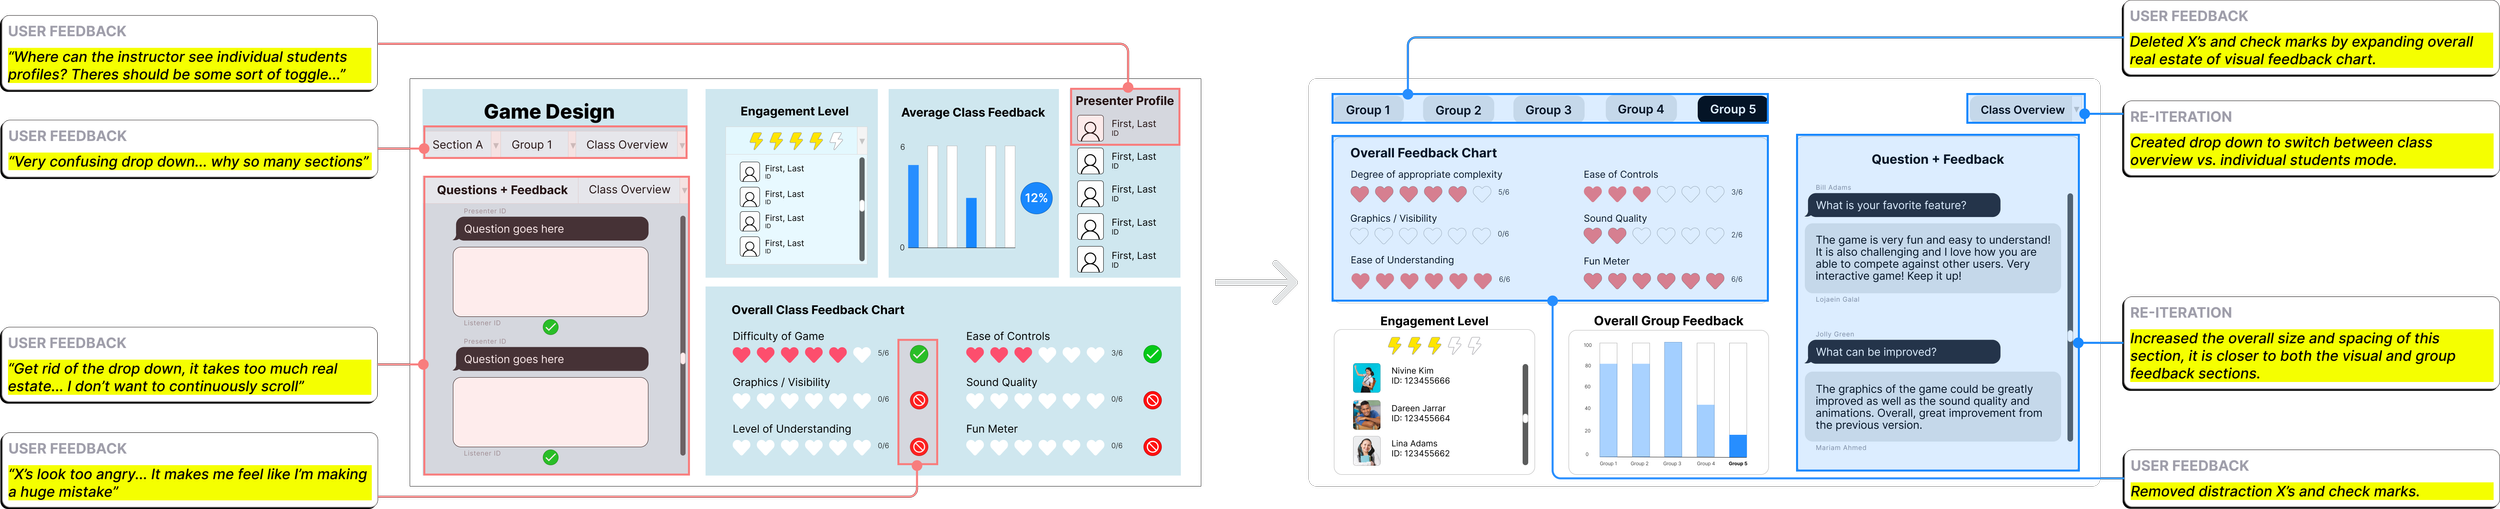
Re-iteration
Instructor View (Individual Student)
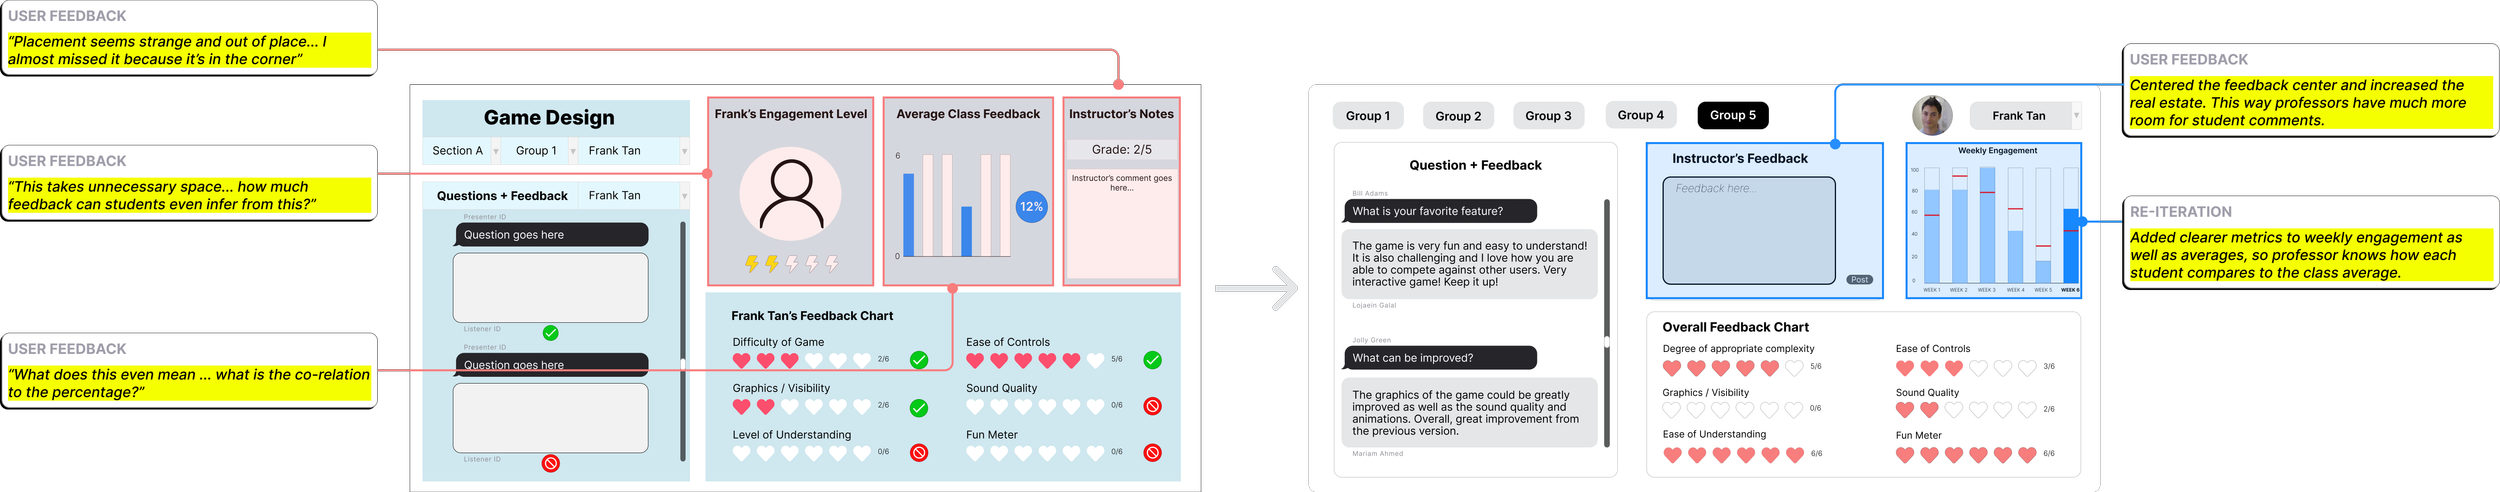
Re-iteration
The color palette is kept quite simple, minimal and easy to read for all stakeholders.
I took a spin on the traditional primary color wheel, and to modernize them. Also wanted to utilize the primary colors in a soft way using various opacities, this brought ease to students in a stressful environment.

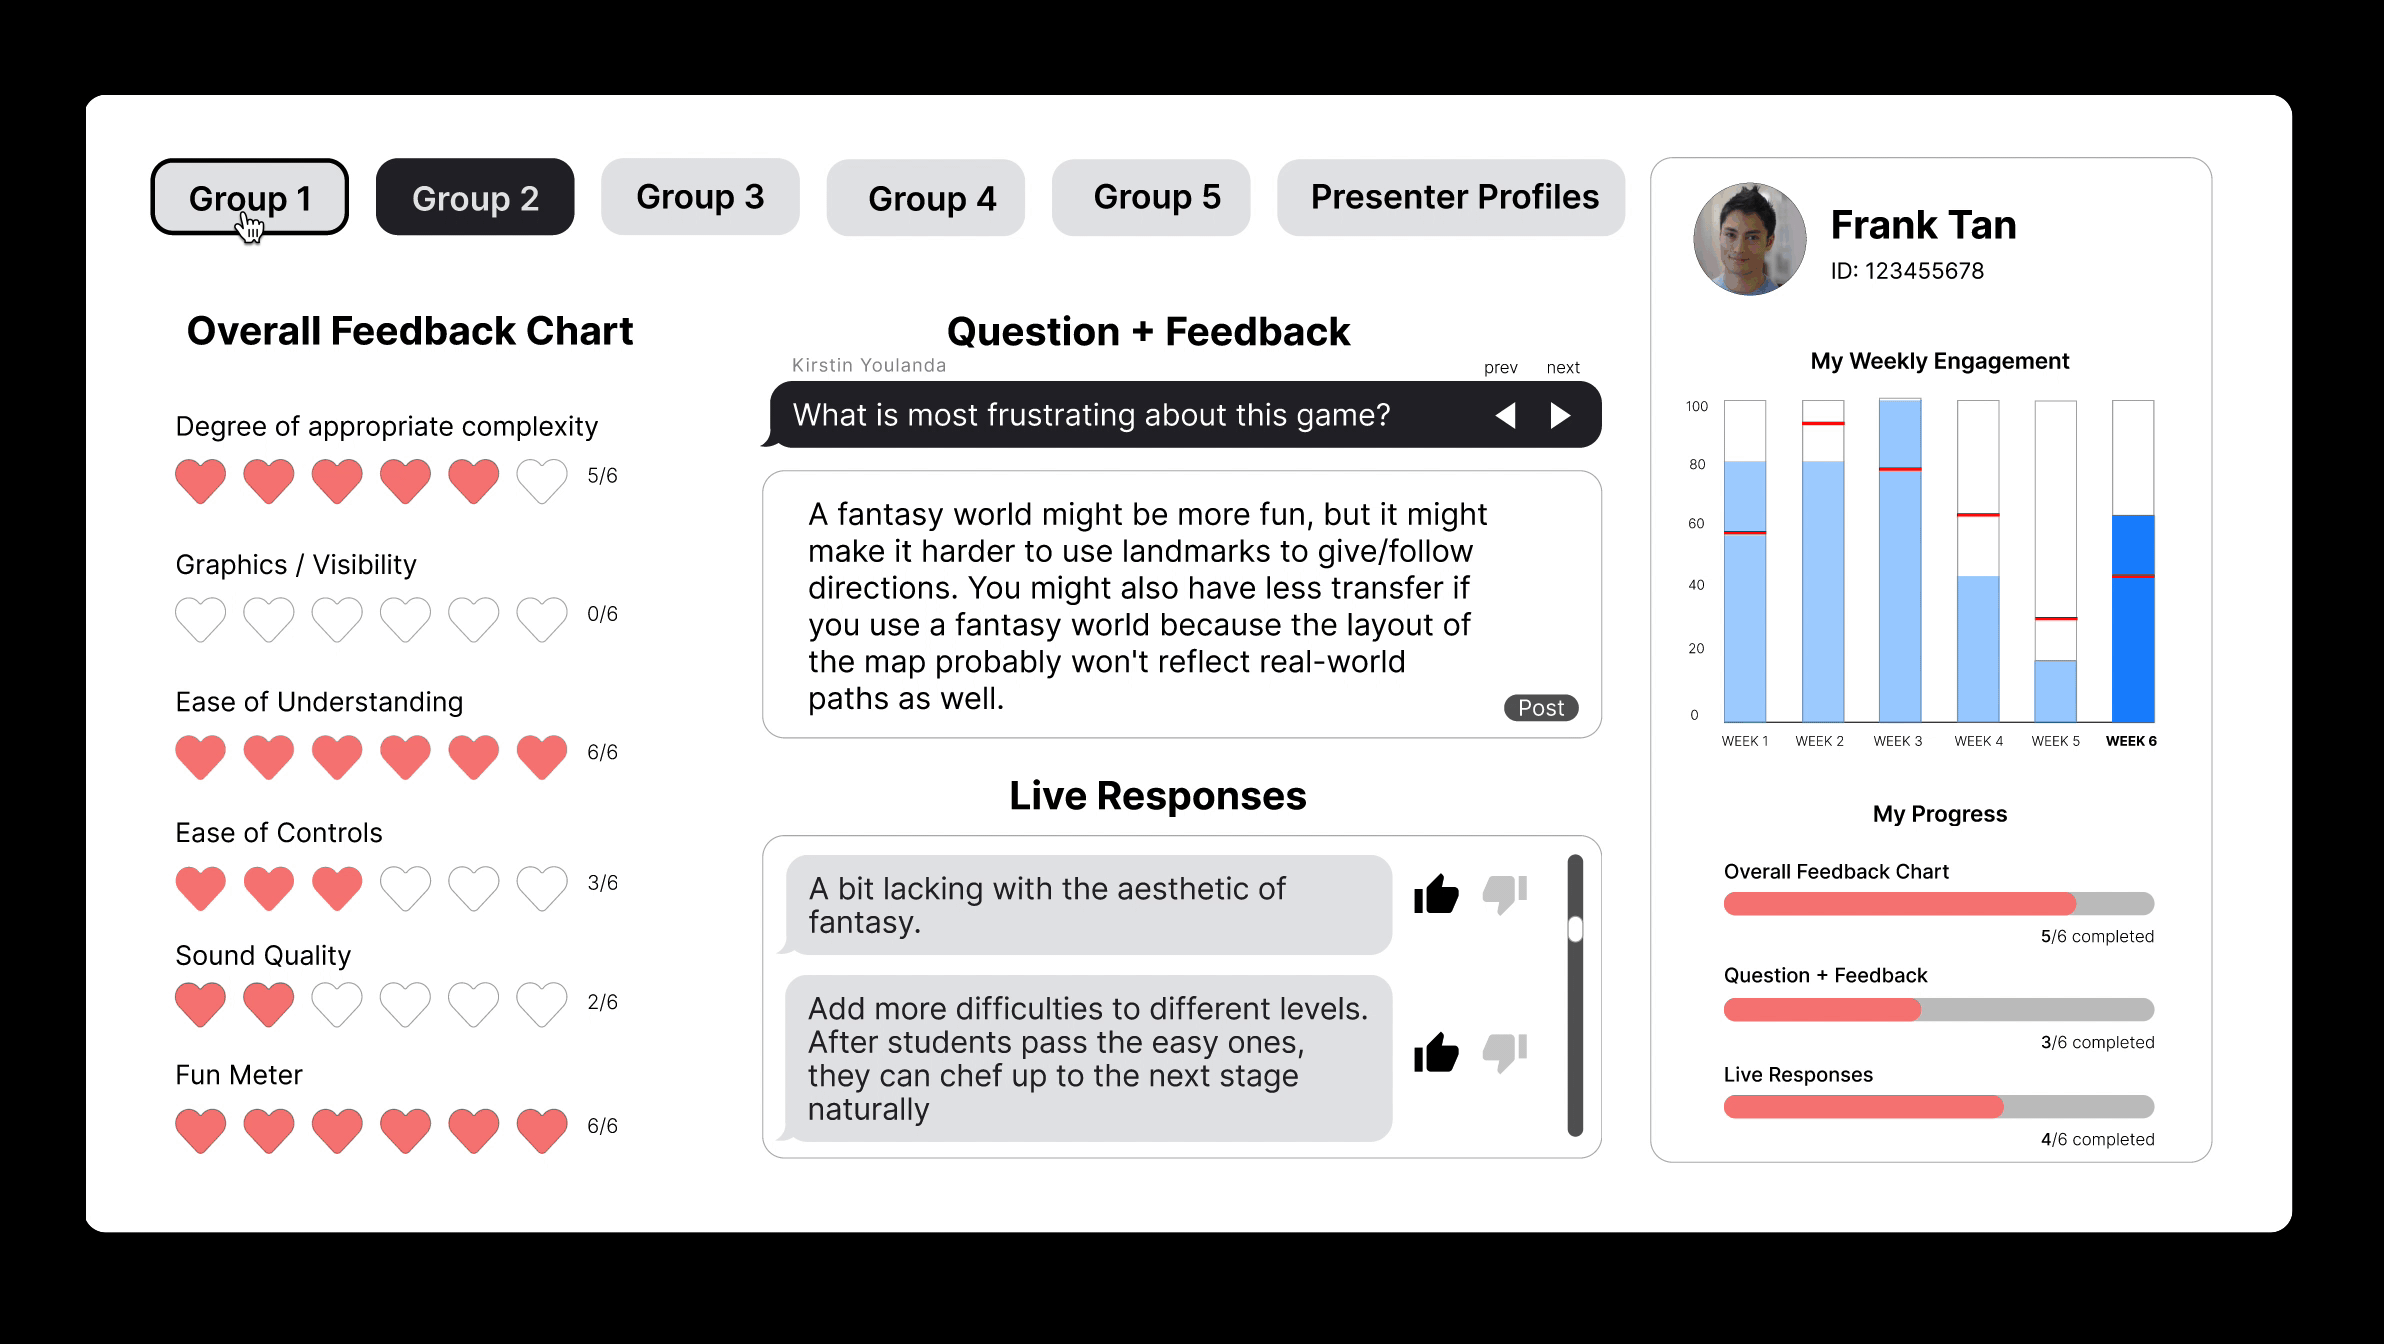
Student Profile
Final Design


Final Design
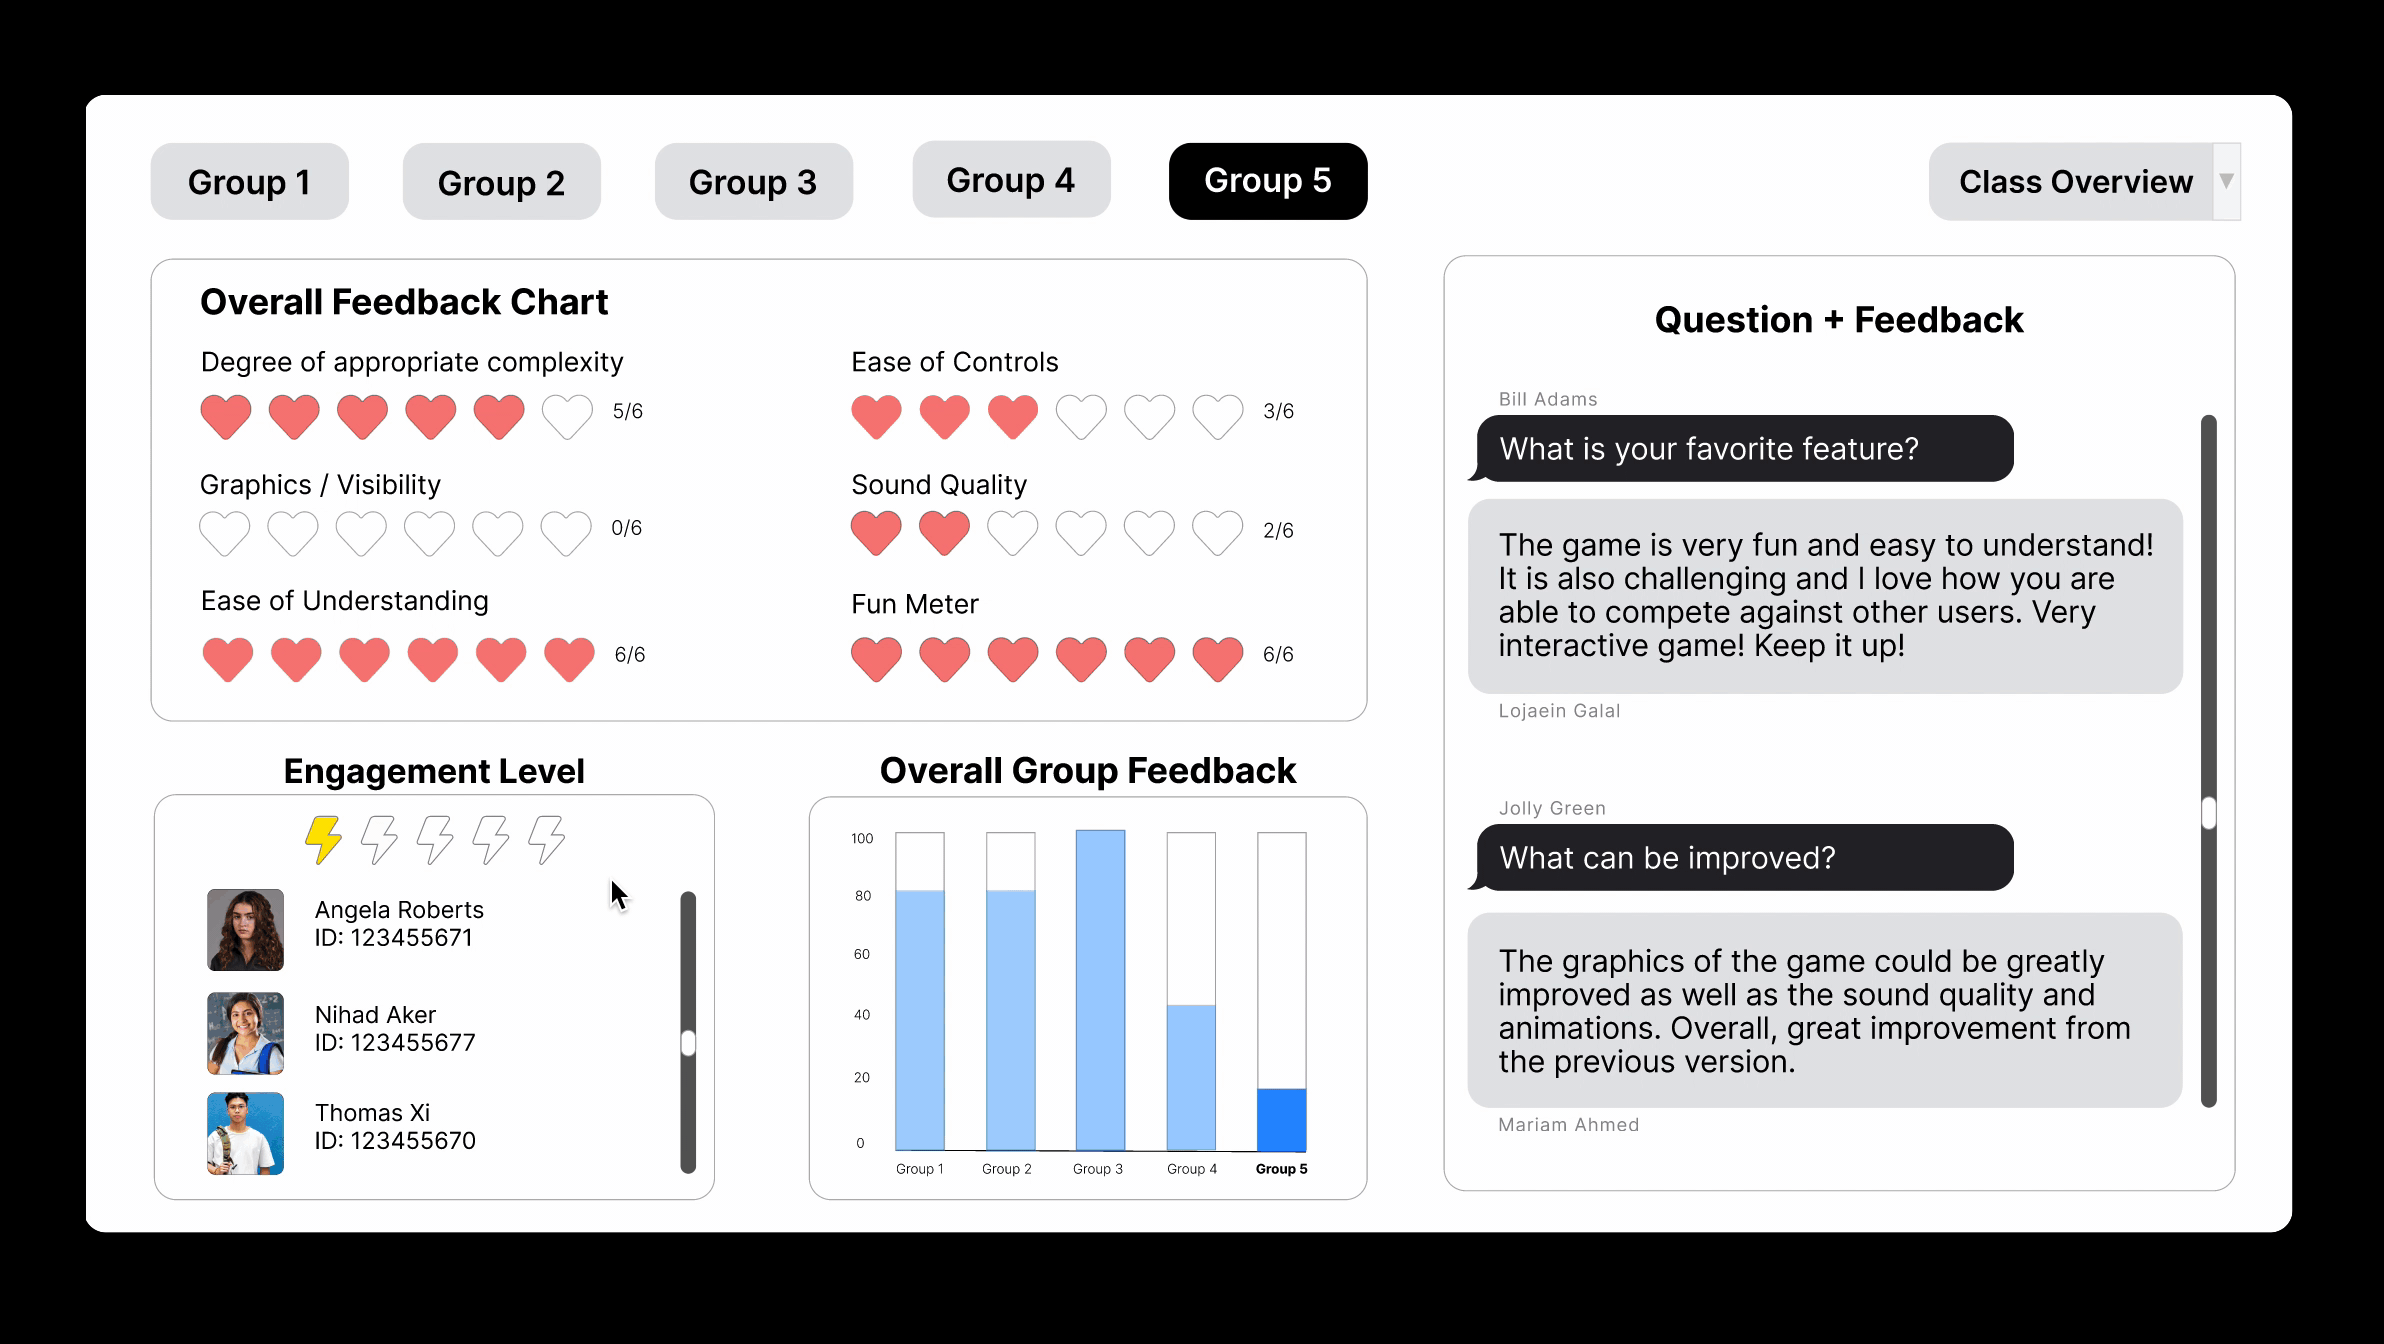
Instructor Overview (Class Overview)

Final Design
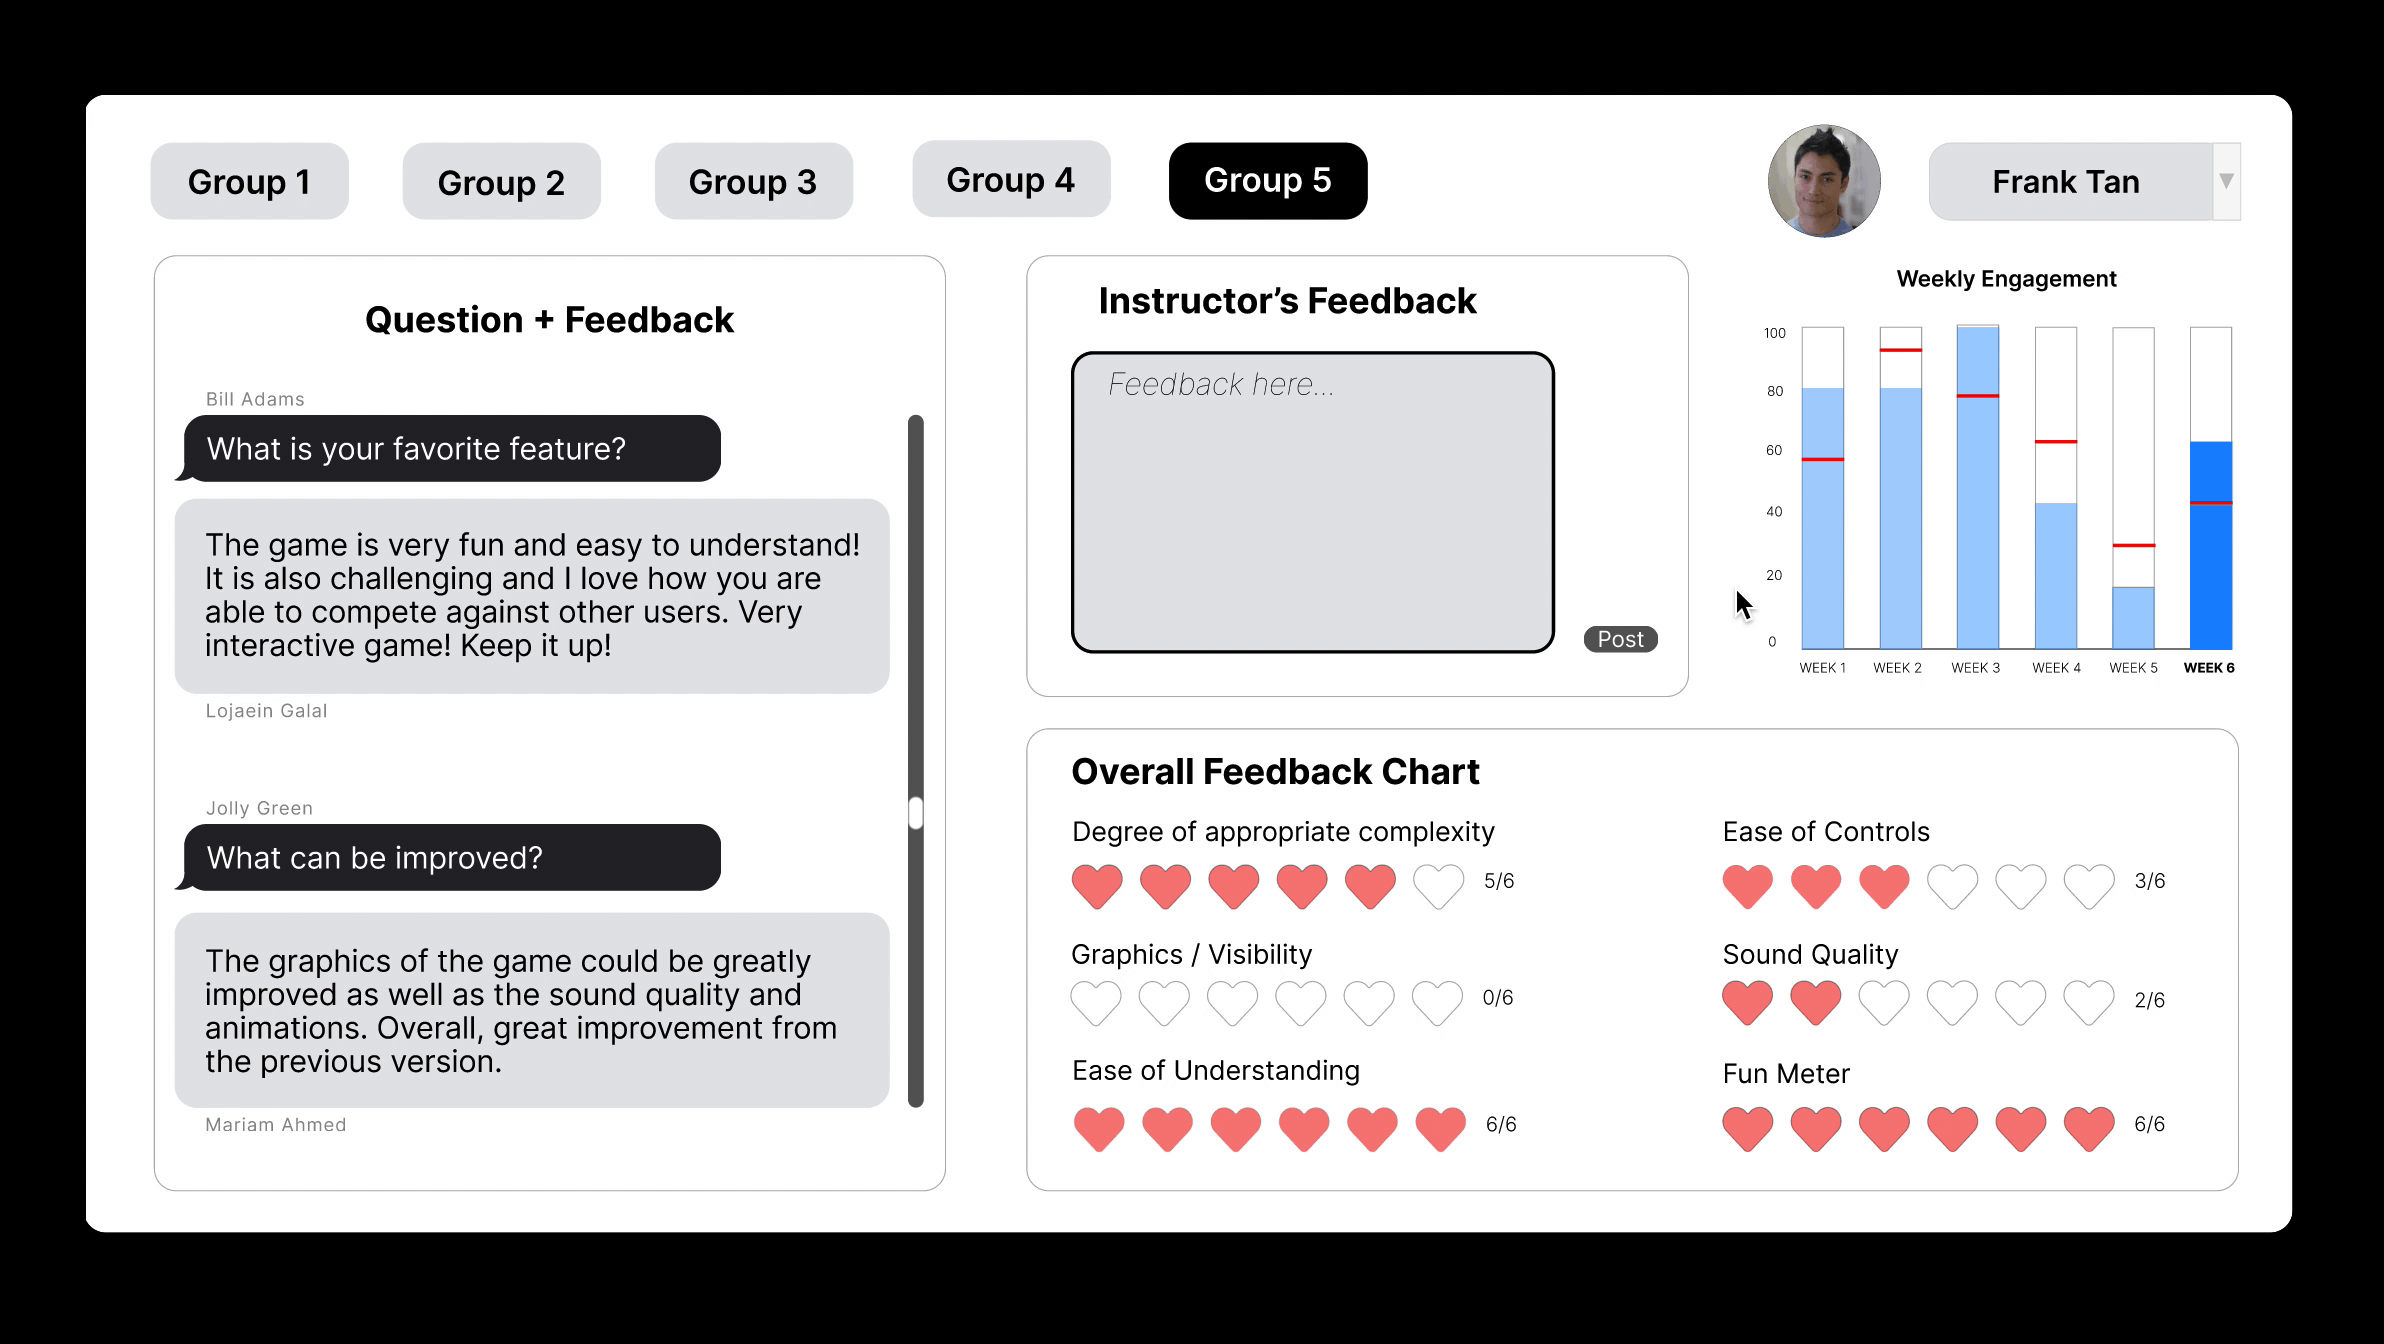
Instructor Overview (Individual Student)

Reflection
⏭ Next Steps
How does this product compare to its competitors?
Let’s validate that student and instructor interactions are actually streamlined. It would be great to do another round of user testing with a specific target audience in mind (students and instructors). Have them perform a Think-A-Loud would be helpful as their experience and user flow can really be beneficial for the next iteration.
📚 Take Aways
The importance of researching and knowing the user.
It is important to find ways on how to connect the instructor → listener → presenter and to see what type of things are overlapped and what are specifically designed for that user. This case also taught me the importance of making the interface interactive and responsive through animations. It is about feedforward/feedback. Overall, this interaction / animated task allowed me to better my skills in Figma as well and familiarize myself with the tools.